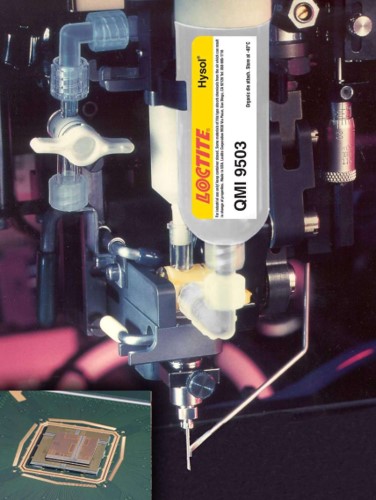
 This post will cover the interpretation of a typical controlled stress flow curve for a highly filled uncured material. In many electronic applications, the adhesive or coating is applied to the substrate using dispensing equipment where the filled material is in a syringe and either air pressure or an auger is used to flow the material through a small needle onto the substrate. The rheology of the adhesive during dispensing can be quite complex depending on the filler loading and filler type. Controlled stress rheology can provide insights into the rheological behavior during dispensing. Dispensing image courtesy of Henkel.
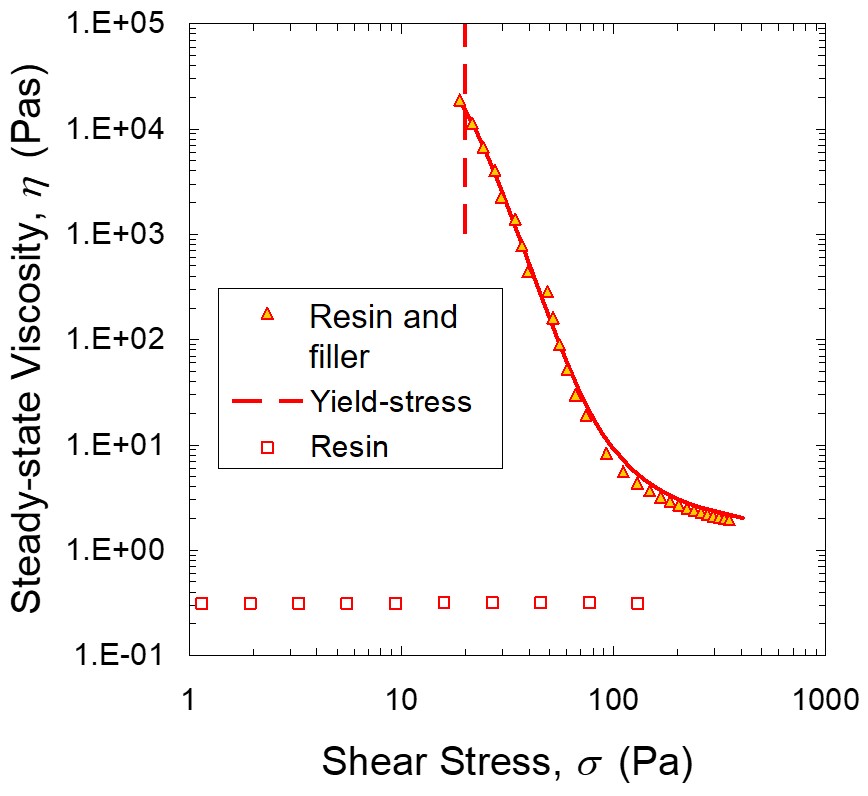
The last post described how the controlled stress experiment is conducted. In Figure 1, the viscosity is plotted as a function of shear stress for a highly silver-filled epoxy adhesive.
Figure 1. Steady state viscosity as a function of shear stress
The curve in Figure 1 was obtained by a careful controlled stress experiment. The data was not obtained using an automatic stress sweep to avoid artifacts. In Figure 1, the viscosity at each point was obtained by applying a stress (torque) and then measuring the steady state shear rate and calculating the viscosity.
The triangle data points (with the solid line) is the viscosity of the highly filled adhesive. In this case, the filler was silver flake mixed in an epoxy resin. The open squares in Figure 1 is the viscosity measured on only the resin portion of the adhesive. In order to achieve high filler loading and reasonable dispensing, the viscosity of the resin needs to be very low. In Figure 1, the resin viscosity is both very low and is independent of the shear stress. When the viscosity-stress or viscosity- shear rate is independent of the shear rate or shear stress, the liquid is termed Newtonian.
Now let’s turn our attention to the viscosity-shear stress curve for the highly filled adhesive. One notes that the viscosity changes by about 4 orders of magnitude over a two orders of magnitude shear stress range. Note that the viscosity of the highly filled adhesive is not measured until about a shear stress of 20 Pa. At stresses higher than 20 Pa, the viscosity drops dramatically as a function of shear stress. A fluid that exhibits the viscosity-shear stress behavior shown in Figure 1 is termed “shear thinning” in that the viscosity decreases with increasing shear stress or shear rate. The vertical dashed line in Figure 1 denotes the yield stress (about 20 Pa in this adhesive).
So you might ask, if the resin (open squares) is Newtonian and the highly filled system is shear thinning, then what causes the large viscosity decrease with shear stress?
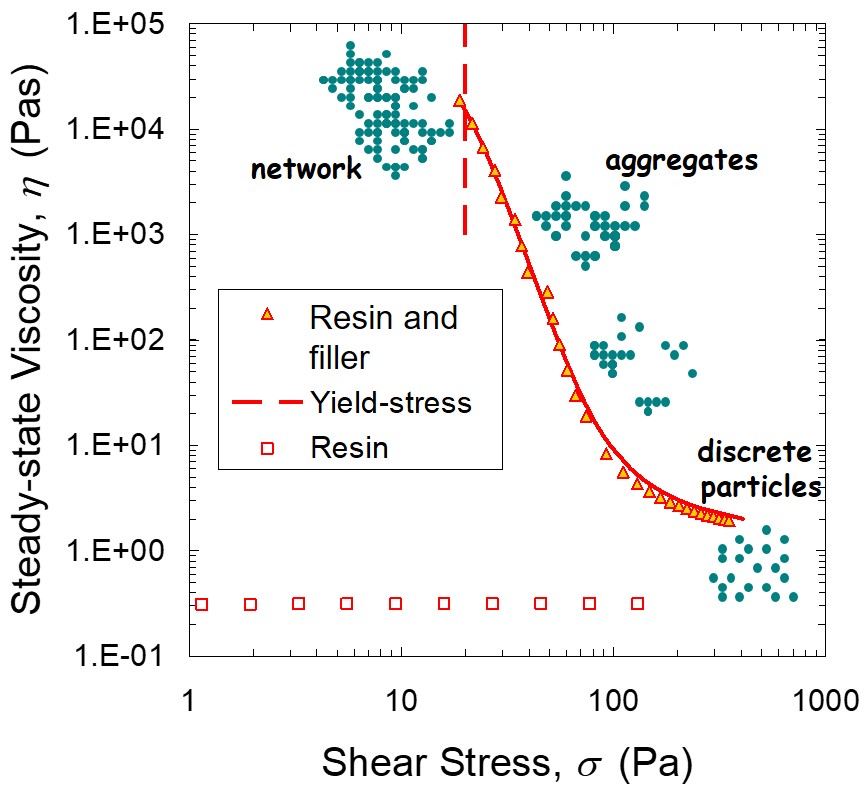
Figure 2. Steady state viscosity as a function of shear stress with schematic of the particle-particle interactions
Figure 2 presents the same data from Figure 1, but schematics are added to depict the particle-particle interactions. One observes that at the yield point, the particles are strongly interacting forming a pseudo-network. Until the yield stress is exceeded there is no flow in this type of experiment. Therefore, above the yield stress, the particle-particle interactions are broken or disrupted. As the network is broken down into aggregates, the viscosity decreases. With continued increasing shear stress, the aggregates are broken into discrete particles. At low viscosities, most of the network and aggregates are broken into discrete particles and at this point the viscosity begins to level off as observed at a viscosity of about 400 Pa.
At the high shear stresses, one needs to carefully observe that the adhesive is not “spinning out of the gap” and making the viscosity data unreliable. In Figure 3, we will “put it all together.”
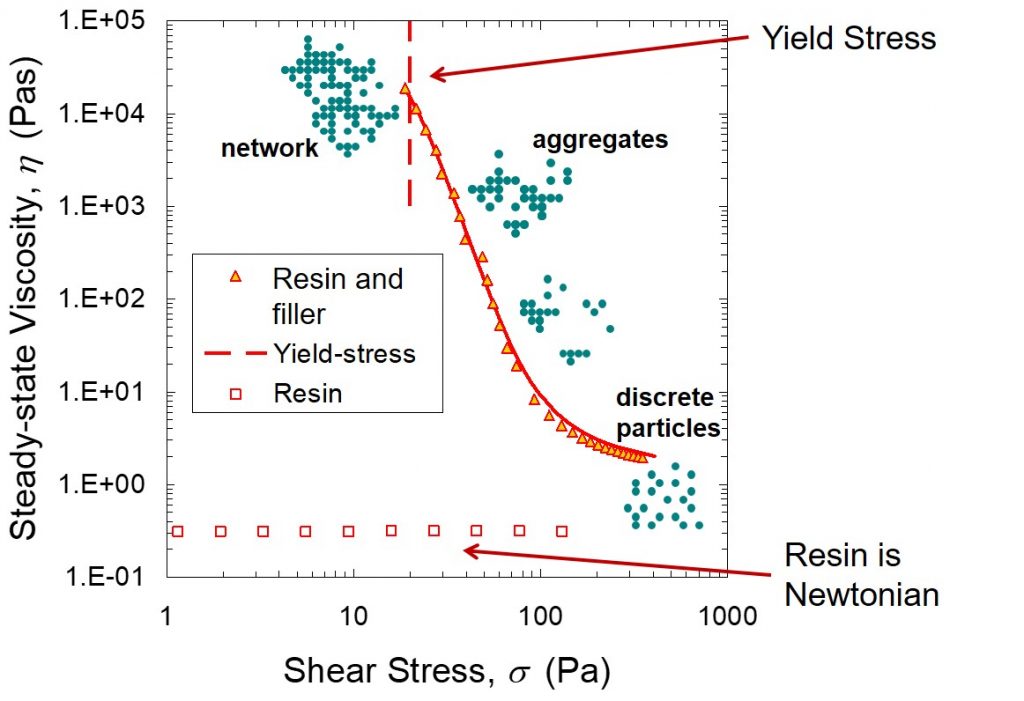
Figure 3. Steady state viscosity as a function of shear stress showing all the elements of the controlled stress flow curve
To summarize, many highly filled systems exhibit a yield stress as shown in the above figures. Typical adhesive or coating formulations have very low viscosity resin components to allow for high filler loadings. The low viscosity resin exhibits Newtonian viscosity-shear stress (or shear rate) behavior.
The data and schematics in Figure 3 shows:
- The silver-filled adhesive is highly shear thinning, caused by progressive breakdown of the particle-particle network
- Yield-stress at 20 Pa where the viscosity is infinite or very high low shear viscosity
- Resin usually shows Newtonian behavior over entire shear stress range
- Viscosity-shear stress relationship is completely dominated by the filler particles


Leave a Reply