Over the years there have been many posts on the characterization of polymers that were focused mainly on thermosets. In the next series of posts, we will discuss various types of mechanical testing that can be used to characterize the mechanical properties of both thermosets and thermoplastics. In this post, we will discuss tensile testing for polymers.
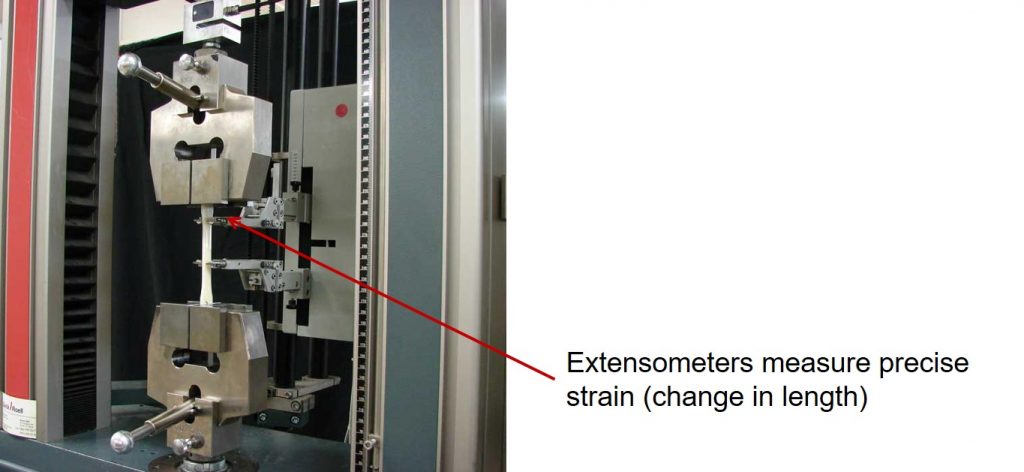
ASTM D638 describes the Standard Test Method for Tensile Properties of Plastics. ASTM D638 is applicable for testing specimens of any thickness up to 14 mm (0.55 inch). For tensile testing of very thin samples (films of less than 1 mm (0,04 inch), ASTM D882 is the preferred test method. This post will cover D638 for the sake of clarity. The tensile test measures the load (stress) as a function of the deformation (strain) using an instrumented test frame. The load is measured using a calibrated load cell and the deformation is determined either from the crosshead motion or using an extensometer attached to the sample. In Figure 1, the experimental setup is shown.
Figure 1. Tensile testing apparatus
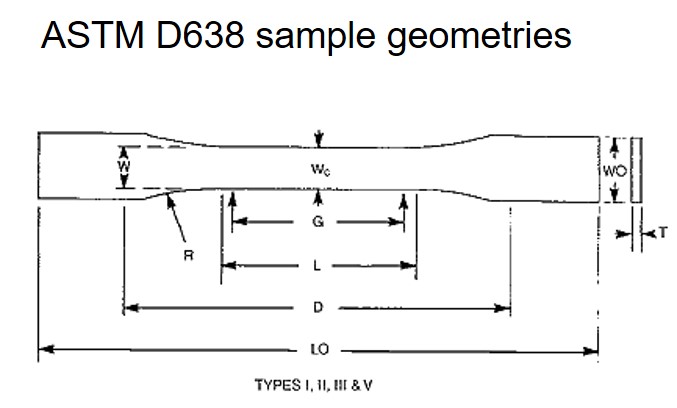
Sample geometry is called a “dog-bone” type. The gauge length (L) and width (w) in the middle of the sample are designed to provide an area of uniform stress during the test as shown in Figure 2. The design minimizes noise from potential grip or clamping issues and provides for a smaller, uniform cross-sectional area for the tensile deformation. Refer to ASTM D638 for specific sample lengths depending on the type of materials being tested. Sample preparation is also an important aspect to get reproducible results. Small nicks or scratches in the sample may result in premature failure or non-representative tensile data. At least five (5) samples are tensile tested for isotropic materials. Samples can be machined from polymer sheets, molded plaques, or injection molded parts. Care should be taken to understand any sources of variation such as filler anisotropy or fiber orientations which could make the samples anisotropic and thus complicate the tensile data.
Figure 2. Typical “dog-bone” tensile specimen geometry
After the sample is placed in the grips and the extensometer is attached, the tensile experiment starts by applying a load by moving one crosshead at a fixed speed and measuring the load transmitted through the sample with a load cell on the opposite side of the sample. Testing frames vary in design, but a typical tensile load frame has the load cell on the top, fixed crossbar and the lower crossbar moves downward at a fixed speed. For most sample types, the crosshead speed is 5 mm/min (0.2 in./min). The speed should be controlled to at least ± 25% (per ASTM D638).
Figure 3. Load deflection or stress-strain curve with specific tensile properties identified (Figure from ASTM D638)
In Figure 3, there are three types of typical stress-strain curves presented. The first type of curve is shown on the left where the load (stress) increases until the sample breaks at point A. Notice that the initial portion of the stress strain curve is a straight line indicating linear elastic behavior. In other words, if the load was released along curve A, then the material would return to the original dimensions (or actually pretty close). Think for this as a simple stretching and relaxing. The point A is designated as the tensile strength at break and the elongation (strain) at break. The slope of the initial linear stress strain curve is called Young’s Modulus.
In the second curve in Figure 3 (B and C) we observe a large deviation from the linear portion until the material exhibits a yield point at B. At points along the curve leading to B that are not on the linear portion would exhibit permanent deformation when the load is released. After the yield point (B), the stress begins to decrease with increasing strain until the sample breaks at point C. At Point B the tensile strength at yield and the elongation at yield is determined. At Point C where the sample breaks, the tensile stress at break and elongation at break are measured.
The curve on the right shows a stress-strain curve for a material that strain hardens. As in the previous stress-strain curves, there is an initial linear (elastic) portion followed by a deviation from linearity indicating permanent (or plastic) deformation. At point D, the tensile stress and elongation at yield are determined. Notice that from point D to point E, the stress increases. This phenomenon is called “strain hardening” and is observed in both metals and plastics. In the case of thermoplastic polymers, the tensile elongation causes the polymer chains to align in the tensile direction and thus increase the stress and load bearing capability.
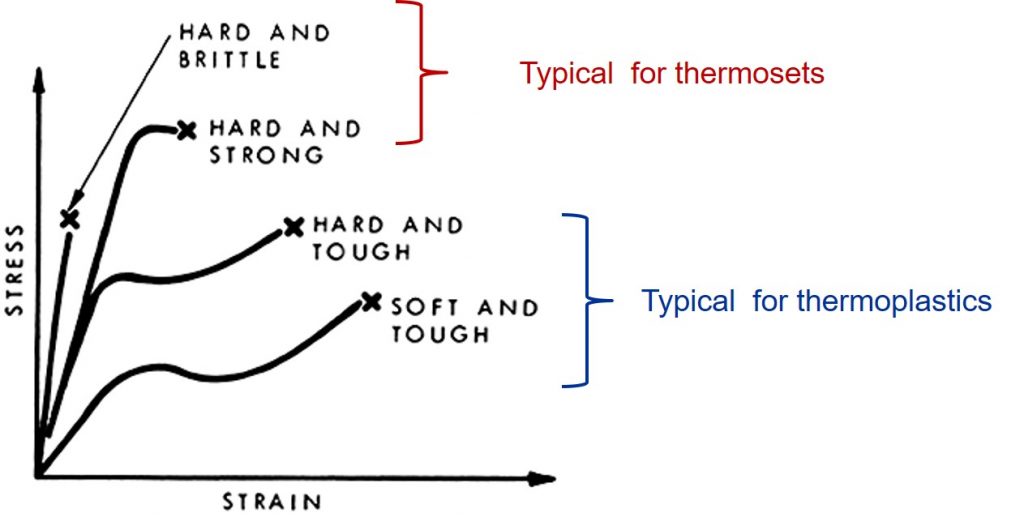
In Figure 4, several examples of stress-strain curves are shown for thermosets and thermoplastic polymers.
Figure 4. Tensile Stress-Strain curves for typical plastics
Let’s first look at the two curves for the thermosets. Thermosets owing to the highly crosslinked structures can exhibit brittle behavior resulting in a linear stress-strain curve with little plastic deformation prior to breakage. Note that the slope of the stress-strain curve is very high, i.e. high Young’s Modulus but the strain at break is small indicating brittle type behavior. These materials are termed hard and brittle. The brittle nature is typically a drawback so formulators modify the crosslinked network or add modifiers to make the material less brittle. In the second curve from the left in Figure 4, the thermoset has a lower Young’s modulus (lower slope in the initial portion of the stress-strain curve) but has some elongation and yielding prior to the sample fracturing. In this case, the tensile strength at break is high and the material has a good elongation at break indicating some toughness. Unmodified, high Tg thermosets typically exhibit the hard and brittle type stress-strain behavior. Toughened or thermosets with a lower crosslink density will exhibit the “hard and strong” type behavior. Note there is no strain hardening in the thermosets. Due to the crosslinked structure of the fully cured matrix, the network chains cannot easily align in the tensile direction.
Thermoplastics typically have lower Young’s modulus, but much larger elongation (strain) at break. In Figure 4, both of the thermosets exhibit a yield point followed by strain hardening (increase in the stress as the elongation increases). As mentioned earlier, strain hardening is usually found in high molecular weight thermoplastics since the long chain molecules can align in the tensile direction after yielding, resulting in and increase in the stress as a function of increasing strain. Many thermoplastic polymers such as polyethylene can have very high elongations at break (upwards of 400-800%). These polymers are termed “soft and tough” since the Young’s modulus is typically low, but after yielding, they can exhibit a large amount of continued elongation.


Textile Tensile Testing Machine is designed to test a wide range of materials in tension, bursting, tear, elongation, constant load, elastic, thread slip, peeling and other mechanical properties. Tensile Strength Tester complies with ISO 13934.1/2, ISO 13935.1/2, ISO 9073.3/4, etc.
Hi, thanks for the informative blog.
I’m in search of more info on how thermosets behave under high strain rates. For example for thermoplastics, they become more brittle (higher stiffness, but lower elongation at break) under high strain rates. How do thermosets behave under high strain rates?
Thanks!
Dear Jeff. Thanks for sharing all your knowledge, very valuable. I’m working with epoxy development since 15 years, and I’ve learnt a lot from your blogs and papers. I’m working in a project where we are restricted to isothermal cure below the maximum Tg(infinity) of the epoxy formulation which results in vitrification and uncomplete cure at limited conversion. From theory I expect stiffness to be similar for various polymers due to vitrification and transformation into the glassy state. But that the strength depends on conversion and crosslinking density. For our application, vitrification occurs and hence, the epoxy will be in the glassy state which dominates stiffness (clearly shown from DMA). But how does vitrification affect the strength?
An interesting question is what the stiffness and strength for uncured resin (zero conversion) cooled down below Tg(0) so it is transformed to the glassy state would be, compared to the same resin reaching a conversion of 60% due to vitrification (also in the glassy state)? Hence, tensile testing must for both cases be measured in the glass state. I expect stiffness to be similar but what about the strength? Do you have any experience or papers to share on this subject? Best regards, from Dr. Dan Forsström, Polymira AB, Sweden.