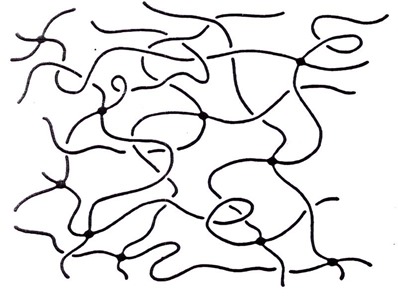
 In the last few posts we have been talking about the curing of thermoset resins. For a wide variety of products, ensuring the cure process is well characterized is key. As we know, thermosets typically start as small molecules (monomers and oligomers) to allow ease of processing for applications such as adhesives, composites, laminates, and coatings. Once the curing chemistry is initiated, typical thermosets undergo chain extension in the early stages of cure followed by crosslinking to build a fully cured network. So the question is: what are the best ways to monitor the curing of thermosets?
In this post we will outline the various approaches monitor the progress of the curing reactions. In subsequent posts will provide more details for the most common techniques. Some methods for cure monitoring are:
- Fourier Transform Infrared Spectroscopy (FTIR) – reaction of specific chemical groups
- Differential Scanning Calorimetry (DSC) – Heat of reaction and Tg
- Thermal Mechanical Analysis (TMA) – Tg
- Dynamic Mechanical Analysis (DMA) – Tg and modulus
- Oscillatory Rheometry – complex viscosity as a function of temperature/time
- Dielectric Spectroscopy – Dielectric loss factor (correlates with viscosity)
You can see that there are several experimental methods (and there are potentially even more) to assist the process engineer/scientist to evaluate the degree of cure during a curing process.
FTIR is useful in that you can track the reaction of a specific chemical species during curing. For example, it is common to use FTIR to monitor the decrease in the epoxy group at 915 cm-1. While this provides specific information on the reaction of the epoxy group, at high levels of conversion (low amounts of residual epoxy groups), it becomes difficult to precisely measure the FRIT peak intensity. The same drawback occurs when using DSC to measure the residual heat of reaction at high extents of cure. With that said, what is a good way to monitor the degree of cure at high levels of conversion?
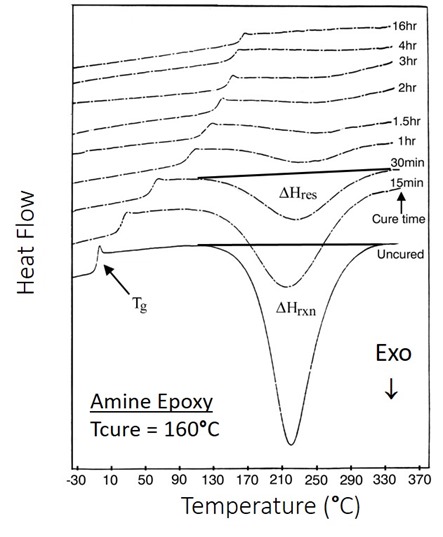
The answer is to measure the glass transition temperature. In Figure 1, DSC curves are shown for various times during isothermal curing of an epoxy amine at 160oC.
Figure 1. DSC heat flow as a function of temperature for the isothermal curing of an epoxy amine.
In Figure 1, the exotherm for the uncured material is large and well defined making it easy to measure the total heat of reaction (DHrxn). As the cure progresses the residual heat of reaction (DHres) decreases as reactive groups are consumed. Note that as the cure time approaches 4 hours and greater it is difficult to measure DHres. The DSC data can be used to calculate the degree of conversion using the following equation:
When DHres becomes very small at high levels of conversion it becomes hard to accurately calculate the degree of conversion.
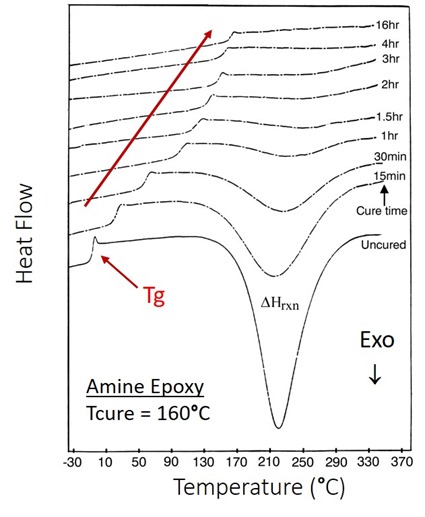
Figure 2. DSC heat flow as a function of temperature for the isothermal curing of an epoxy amine highlighting the increase in Tg with cure.
As can be seen in Figure 2, the glass transition temperature (Tg) continues to increase with longer curing times. Note that at 4 hours, the DSC heat flow baseline is flat and this could potentially be erroneously concluded that the curing is complete. The Tg increases from the 4 hour to 16 hour cure DSC trace. At high degrees of cure, the glass transition temperature is the best indicator of the degree of cure. In the next post we will discuss more about the physical meaning of the glass transition temperature and explore the Tg-conversion relationship.
References
1) Wisanrakkit and Gillham, J. Appl. Poly. Sci., 42, 2453 (1991)


Leave a Reply