Guest post by Dr. R. Bruce Prime
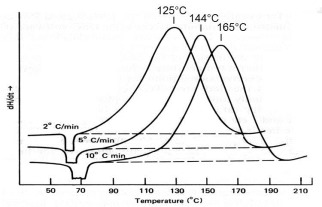
 In Part 2 of this series we introduced the concept of multiple heating rate kinetics. Here we delve into the details of this method, both the principles and how it can be used to measure not only the activation energy (E) but also the constancy of E as a function of conversion, Ea. Following the survey DSC at 10°C/min the next recommended step in a kinetic study is to perform additional DSC runs at a minimum of two but preferably three or four additional heating rates. An example would be 2, 5, 10 and 20°C/min. If Ea is constant with conversion the cure reaction is relatively uncomplicated and the kinetic analysis fairly straightforward. On the other hand, a change of Ea with conversion is indicative of complex cure chemistry which must be taken into account in the kinetic analysis. Often, but not always, complexity can be observed in the survey run as a shoulder on the DSC exotherm or even a second peak. A recent review paper covers this topic nicely [Lyon, J. Test. Eval. 42, 1387 (2014)].
First we need to introduce the concept of isoconversion on which this method is based. In an isothermal isoconversional study we measure the time to reach a constant conversion level as a function of temperature. We will treat this type of study in future posts. In a multiple heating rate study we measure the temperature to constant conversion vs. heating rate.
Next we rewrite Eq. 5 in Part 2 for the general case
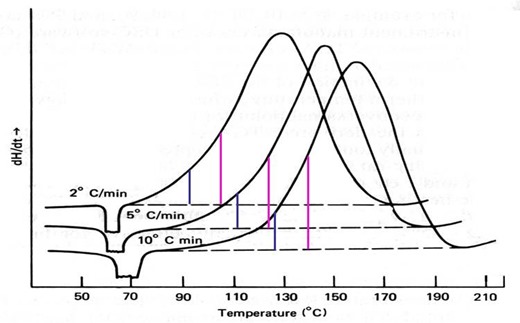
where Ta is the isoconversional temperature, including the peak temperature Tp. Software to perform this analysis is provided by all the DSC manufacturers. The figure below illustrates this method, where the green lines represent 10% conversion and the magenta lines 20%. By continuing this process to include the entire cure exotherm, e.g. up to 90%, one can measure Ea over the entire range of conversion.
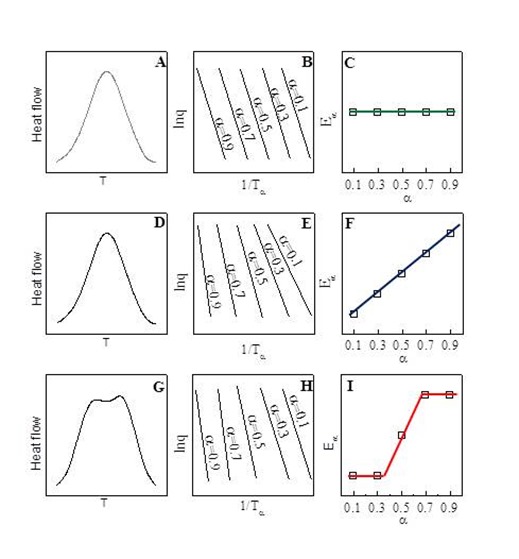
The figure below shows three possible outcomes. In the ABC series we see an uncomplicated, symmetric DSC exotherm (A), a series of ln q vs. 1/Ta curves all with the same slope (B), and a plot showing that Ea is constant with conversion (C). In the DEF series we see a DSC exotherm that appears similar (D) but with ln q vs. 1/Ta curves where the slopes increase uniformly with conversion (F), and a plot showing Ea increasing continuously with conversion (F). And in the GHI series we see a complex DSC exotherm with two peaks suggesting two reactions (G) with ln q vs. 1/Ta curves with the same slope at 10 and 30% conversion but then shifting to higher but equal slopes at 70 and 90% conversion (H), and a plot showing Ea changing from a low value for the early reaction to a higher value for the later reaction (I).
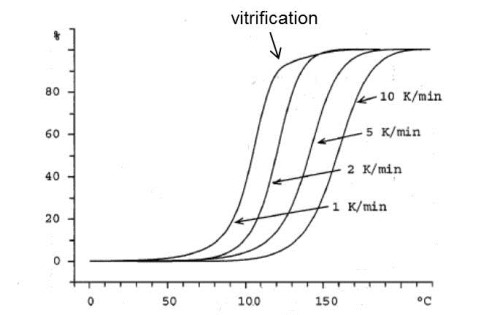
We finish this post with a discussion about the choice of heating rates. We recommended four to five heating rates to obtain good statistical data and gave an example of 2, 5, 10 and 20°C/min. We recommend not going below 2°C/min in order to avoid vitrification which can occur at very slow heating rates. Vitrification can be observed in the 1°C/min curve in the figure below. Vitrification is not isoconversional. As an example it will occur at increasing conversion levels with increasing cure temperatures below Tg¥ or increasing heating rates below approximately 2°C/min. For this reason including data beyond the point of vitrification will lead to erroneous values for activation energy. In the figure below accurate Ea values would only be obtained for data up to about 80% conversion, i.e. prior to vitrification. At very fast heating rates it is possible for degradation to occur before cure is complete if the temperature is much above 200°C. For some thermosets 40°C/min may be ok but for others it may be too fast.
We finish this post with a discussion about the choice of heating rates. We recommended four to five heating rates to obtain good statistical data and gave an example of 2, 5, 10 and 20°C/min. We recommend not going below 2°C/min in order to avoid vitrification which can occur at very slow heating rates. Vitrification can be observed in the 1°C/min curve in the figure below. Vitrification is not isoconversional. As an example it will occur at increasing conversion levels with increasing cure temperatures below Tg¥ or increasing heating rates below approximately 2°C/min. For this reason including data beyond the point of vitrification will lead to erroneous values for activation energy. In the figure below accurate Ea values would only be obtained for data up to about 80% conversion, i.e. prior to vitrification. At very fast heating rates it is possible for degradation to occur before cure is complete if the temperature is much above 200°C. For some thermosets 40°C/min may be ok but for others it may be too fast.
From Schawe, Thermochim. Acta 388, 299 (2002)
In the next post we treat cure kinetics from isothermal DSC measurements.

![clip_image002[5] clip_image002[5]](https://polymerinnovationblog.com/wp-content/uploads/2014/11/clip_image0025_thumb1.png)


Leave a Reply