 In this post we will use all of the information presented in the series and show a very interesting case study on how dielectric measurements in conjunction with complex viscosity measurements can shed light on the physical changes occurring during thermoset curing.
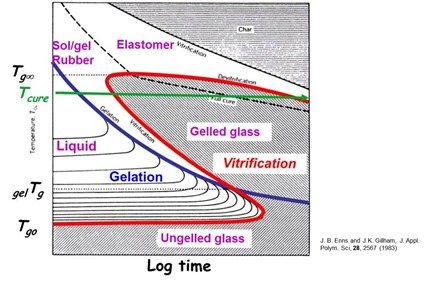
We have seen that dipoles can be used to determine both the glass transition region and if vitrification is occurring during cure. Let’s look at the Time Temperature Transformation (TTT) diagram below:
 The experiment was designed to follow the green line in the TTT diagram. In this case, the Tg of the fully cured epoxy was 170oC and the temperature was ramped in the rheometer to 140oC for force the curing system to vitrify. In the TTT diagram, one observes that the cure path will pass the blue gelation curve, with additional curing will build the highly crosslinked network, but when Tg is approximately equal to Tcure (140oC), the TTT diagram indicates that vitrification will occur (the red curve above). As we showed in the last post, at the glass transition, frequency dependent dipolar relaxations are observed and at vitrification, dipolar relaxations also are observed.
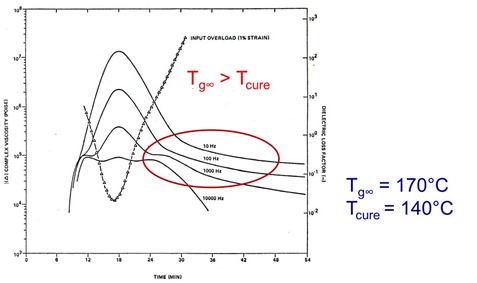
In the following figure, the complex viscosity and dielectric loss factor at multiple frequencies are plotted as a function of time for a non-isothermal ramp to 140oC.
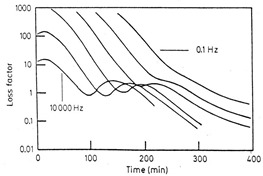
Several key features have been highlighted. As the B-staged epoxy resin goes through the glass transition temperature, frequency dependent dipolar relaxations are observed in the dielectric loss factor at around 8- 12 minutes. The dipolar relaxations correspond to the rapid decrease in the viscosity above Tg. The next feature to note is the frequency independence of the loss factor maximum. From the equation relating the loss factor to the ionic conductivity, one recalls that the ionic conductivity is frequency independent, the the magnitude of the loss factor signal is inversely proportional to the frequency (as the frequency increases, the loss factor maximum decreases). This is clearly observed in the figure above.
The most interesting feature is the existence of the frequency dependent dipolar relaxations when the curing epoxy resin vitrifies. Also, in previous studies, the complex viscosity continues to rise and reach a plateau since the Tg was either well below or slightly below the cure temperature. During vitrification, the rheometer shut down (input overload protection preventing damage to the force transducer). One observed the input overload in the same vicinity of the dipolar relaxations (circled in red above).
In this experiment we have shown that the TTT diagram can be a useful tool to guide the processing of thermosets. Additionally, the dielectric loss factor was shown to be an effective probe for thermoset curing being capable of delineating both the glass transition and vitrification events during non-isothermal cure profiles.


Leave a Reply