 In this post we will continue our discussion of how using simultaneous complex viscosity and dielectric loss factor measurements can provide insight into the non-isothermal curing of thermoset resins.
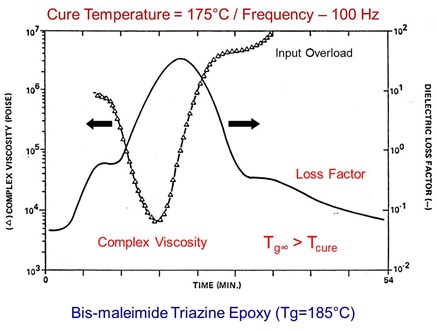
In the following figure, the complex viscosity and dielectric loss factor are plotted as a function of time for a Bis-maleimide Triazine Epoxy resin system. The fully cured Tg for this system is approximately 185oC.
The complex viscosity exhibits the typical behavior for a B-staged thermoset resin. The viscosity decreases rapidly after the resin is heated above the B-staged Tg. Further heating continues to cause the viscosity to decrease until the chain extension and crosslinking reactions result in long growing chains and network formation leading to a minimum in the viscosity and subsequent rapid increase in the viscosity.
The dielectric loss factor (solid line) exhibits several features. The first is the shoulder that is observed in the vicinity of the glass transition region. The second feature is the maximum in the loss factor that occurs near the minimum in the complex viscosity. The third feature is the shoulder on the dielectric loss factor at longer cure times. Note that the shoulder on the loss factor occurs at approximately the same time as the viscosity increases rapidly and the rheometer shuts down (due to force input overload, a protection feature to prevent transducer damage).
Let’s look at each of these features more closely. In the experiment in the figure above, we actually measured the dielectric loss factor at multiple frequencies. In the figure below, we have expanded the scale to examine more details of the loss factor response in the vicinity of the glass transition region.
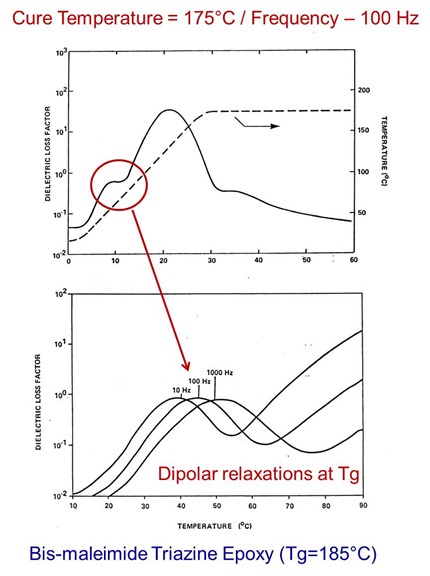 The Bis-maleimide Triazine Epoxy resin used in the experiment was obtained from a B-staged prepreg sample. Thus, the resin was in the ungelled glassy state at room temperature. During the intitial heating ramp, the ungelled glass went through the glass transition temperature. Examining the low temperature loss factor shoulder at multiple frequencies shows the classic frequency dependence associated with dipolar relaxations in the glass transition region.
Examining the loss factor past the maximum will also provide insights into the curing pathways. In the following figure, the temperature ramp was varied from 5.8 – 16oC/minute to a cure temperature of 175oC. In this case the fully cured Tg is greater than the cure temperature.
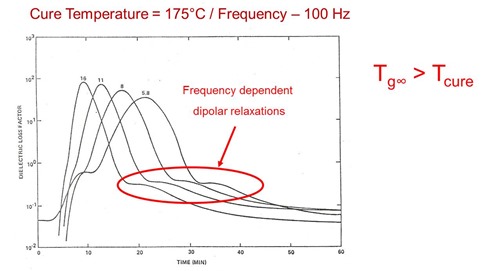 We again observe a series of peaks in the loss factor past the maximum. Since the fully cured glass transition temperature is greater than the cure temperature, vitrification can occur when Tg=Tcure.
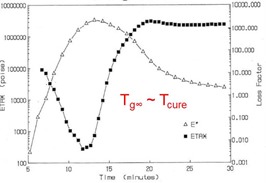
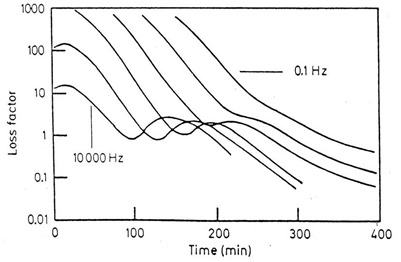
In the following figure, the loss factor is plotted as a function of time at multiple frequencies for an epoxy system where the fully cured Tg is greater than the cure temperature.
In this case, vitrification during curing gives rise to frequency dependent dipolar relaxations associated with vitrification. So why the dipolar relaxtions? Remember during the initial ramp, the resin devitrified (glassy to liquid at Tg) exhibiting frequency dependent dipolar relaxations. Now, when the curing reaction causes the Tg to become equal to the cure temperature, the crosslinking resin begins to become glassy (Tg fully cured is greater than the cure temperature) and similarly the dielectric loss factor exhibits dipolar relaxations. In this case, the resin is going through the glass transition temperature driven by chemical conversion. Nonetheless, the glass transition event is occurring and the dielectric loss factor can detect this.
In the next post we will describe an interesting experiment that will “put it all together.’

Leave a Reply