 In this post we will cover dielectric cure monitoring during non-isothermal curing. Since most thermoset processing is done using a non-isothermal temperature profile (such as the initial heating ramp during lamination and autoclave curing), it will be instructive to examine the dielectric response for temperature ramps.
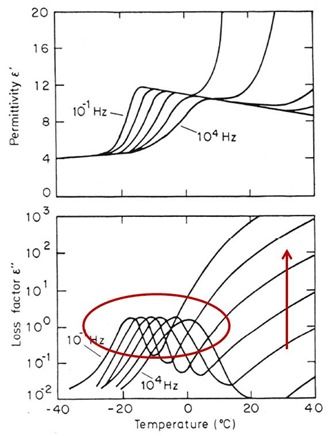
In the following figure, the dielectric permittivity and dielectric loss factor (at multiple frequencies) are plotted as a function of temperature for a DGEBA epoxy (EPON 828, Tg= –17oC) in the vicinity of the glass transition (1).
We present this data to show how the dielectric response changes in the vicinity of the glass transition, since this will be important in future posts where the curing of prepregs will be discussed. In the top figure, the permittivity below the glass transition has the same value independent of frequency. As the temperature increases to near the Tg, the dipoles gain sufficient mobility and contribute to the permittivity. Near the glass transition, the material changes from a glassy state to a liquid in this case. As the epoxy is heated approaching the Tg, there is now sufficient segmental mobility to allow the dipoles to increase the permittivity, with the lowest frequency indicating the beginning of the glass transition. Once through the glass transition temperature, the permittivity achieves the relaxed permittivity (see reference 1 for a more detailed explanation), and then slowly decreases with increasing temperature.
The dielectric loss factor is more instructive for cure monitoring. In the lower figure above, the loss factor shows two distinct regions. The first is the frequency dependent dipolar relaxations occurring in the vicinity of the glass transition temperature. As we will see in future posts, this will be a fingerprint for the glass transition temperature (and additionally for vitrification under the right conditions) during thermoset processing.
After the frequency dependent dipolar relaxations, with continued heating into the liquid region, the ionic conductivity then dominates. This is noted by the red up arrow in the figure. Thus this clearly demonstrates the two components of the dielectric loss factor:
Where the frequency dependent dipolar relaxations are noted by e”d and the ionic conductivity is s.
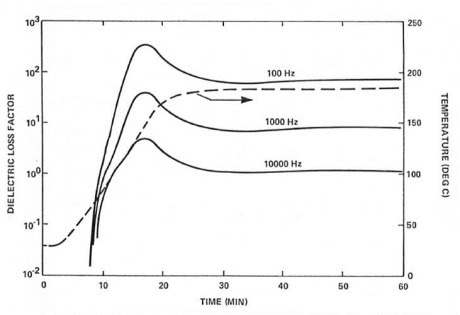
In the next figure, the loss factor is plotted as a function of time for a non-isothermal cure profile noted by the dashed line. This is a simulation of a lamination temperature profile for an epoxy laminating resin.
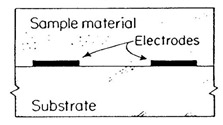
The resin is a B-staged epoxy prepreg. During the initial heating, there isn’t a good dielectric signal. This results from incomplete coverage of the inter-digitated comb electrodes. Until the B-staged resin goes through it’s glass transition temperature, the resin doesn’t adequately cover the electrodes. We will show in future posts how to eliminate this, but for now, let’s focus on the loss factor characteristics.
Initially, after the B-staged prepreg goes through the glass transition temperature, the resin softens as the temperature increases. This is observed as an increase in the loss factor due to the more ion mobility (and s increasing). After the initial softening, the resin begins to chain extend and crosslink. The competing forces of the temperature dependent viscosity decrease and the viscosity increase due to curing, cause a maximum in the loss factor. With further curing, the loss factor decreases and then settles into a plateau. A few features to note:
- There is a shoulder on the early part of the loss factor. The shoulder is due to the frequency dependent dipolar relaxations as the resin transitions through Tg.
- There is a frequency independent maximum in the loss factor that is dominated by the ionic conductivity
- The magnitude of the loss factor maximum is controlled by the frequency (inverse relationship in the equation above).
- For cure monitoring, one wants to choose the optimum frequency to get good cure profiles, but avoid electrode polarization (see reference 1 for more details)
- The loss factor achieves a plateau after about 40 minutes. Since the cure temperature in this case was well above the fully cured Tg (130oC), the material will be fully cured as indicated by the flat line, but the level of the loss factor will be high since the material is in the cured rubbery phase (Tcure > fully cured Tg).
The next post will discuss the simultaneous measurement of the viscosity and the dielectric response.
References:
1) S.D. Senturia and N. F. Sheppard, Advances in Polymer Science, Vol. 80, p. 1-48, 1986


Leave a Reply