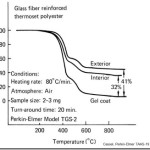
Guest Post by Dr. R. Bruce Prime In the previous post we introduced the basic operating principles of TGA and illustrated some of the more common measurements. In this post we describe even more applications of TGA to thermosets. As demonstrated in the previous post TGA can quantitatively measure the composition of a thermally inert filler such glass fibers. In the ... [Click to Continue...]
Happy Fourth of July

From all of us at Polymer Innovation Blog, we wish you and your family a safe and Happy Fourth of July! Dr. Prime will be back on Monday with another post on Applications of TGA for Thermosets. On July 14, I will discuss dynamic mechanical analysis (DMA) of thermosets and the application of DMA in thermoset characterization on July 21. Starting on July 28, I will ... [Click to Continue...]
Thermoset Characterization Part 12: Introduction to Thermogravimetric Analysis (TGA)
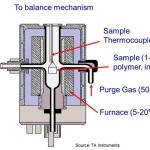
Guest Post by Dr. R. Bruce Prime Thermogravimetric analysis or TGA is a technique where the mass (or weight) of a material is measured as a function of temperature or time while the sample is subjected to a controlled temperature program in a controlled atmosphere [Earnest, ASTM STP 997 (1988)]. Temperature ranges for commercial TGAs are typically ambient to 1000°C or ... [Click to Continue...]
Thermoset Characterization Part 11: Applications of Thermomechanical Analysis (TMA)
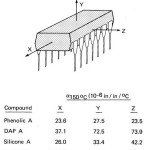
Guest Post by Dr. R. Bruce Prime In the previous post we introduced the basic operating principles of TMA and illustrated the more common measurements. In this post we describe some important applications of TMA to thermosets. As described in the previous post TMA can quantitatively measure the coefficient of thermal expansion on samples with smooth parallel sides. Many ... [Click to Continue...]
Thermoset Characterization Part 10: Introduction to TMA
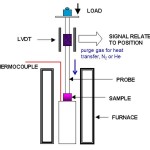
Guest Post by Dr. R. Bruce Prime Thermomechanical analysis or TMA is a simple yet very useful technique that can measure coefficient of thermal expansion, Tg and the dimensional change accompanying the relaxation of stress stored in a material. As shown in the illustration the dimensional change of a material with temperature (or time) is measured in a controlled atmosphere ... [Click to Continue...]